
The “Divident” You Can Rely On
Let’s kick off with a question: have you ever wondered whether your “Divident”—yes, that trusted stream of income—can dry up without warning? Whether you’re counting on it part-time or building an entire strategy around it, understanding the mechanics behind dividend safety is anything but optional.
1. Why Dividend Safety Matters
- A high dividend yield often attracts investors—but without a foundation in earnings or cash flow, it can be a siren’s call leading to disappointment
- Downturns, cyclical dips, or one-off accounting quirks can disrupt payouts abruptly.
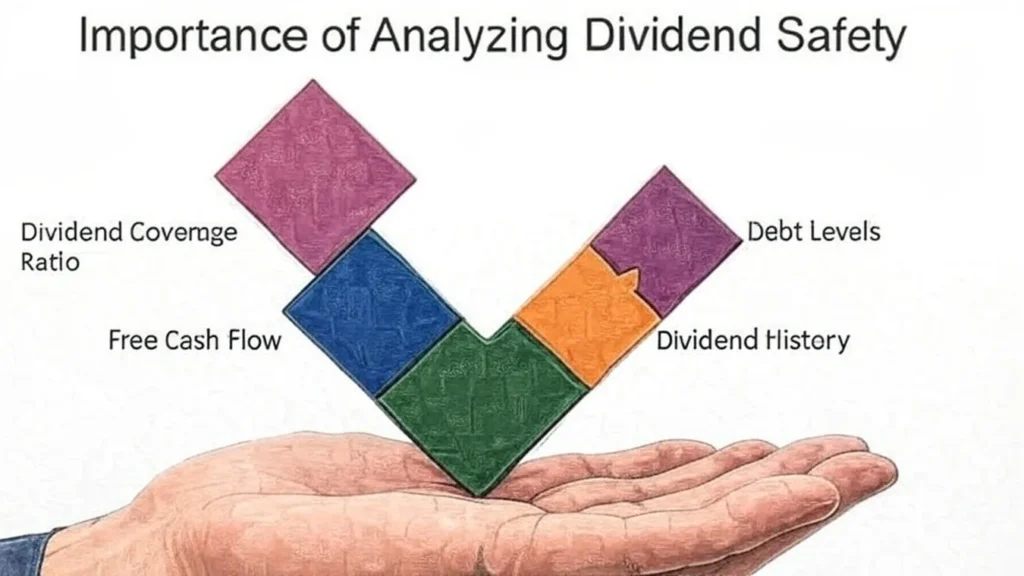
- So, how do you evaluate the resilience of your Divident? Enter payout ratios, free cash flow (FCF), and dividend coverage—the triad guiding your confidence.
2. Payout Ratio: More Than a Number
What it is:
The payout ratio measures the percentage of earnings (or EPS) paid out as dividends.
Why earnings-based ratios can mislead:
Net income includes non-cash items. A firm might appear generous with dividends even while offering little actual cash backing.
Rules of thumb:
- 30%–60% is generally considered healthy, especially for stable sectors like utilities
- Payouts above 100%? Red flag—dividends might exceed earnings and are unsustainable
My experience: In one of my early investments, a net-income-based payout hovered around 80%. But when I checked free cash flow, it was much tighter. That discrepancy taught me to treat earnings-based ratios with caution.
3. Free Cash Flow: Real Money, Real Assurance
What is FCF?
Cash left after capital investments—actual money available to shareholders
FCF-based payout ratio:
This gives a clearer picture of sustainability, as dividends must ultimately be paid in cash
Investor preference: The free-cash-flow payout ratio often tells a more realistic story of financial flexibility and dividend security.
4. Dividend Coverage: The Safety Buffer
Dividend Coverage Ratio (DCR) is the inverse of the payout ratio: net income divided by dividends
- A DCR above 2 is typically considered safe—it implies the company earns more than enough to cover its dividend and invest for growth
- Falling below 1.5–2? That raises concern—your Divident may be on shaky ground.
Coverage via cash flow (CFO or FCF):
A deeper dive: CFO–Coverage or FCF–Coverage ratios consider actual cash inflows. Arbor Investment Planner suggests that anything below 2x CFO is a red flag—dividend drains too much of operational cash
My insight: I’ve seen companies with long track records of payout increases run into trouble because they didn’t account for capital needs. Always look past net income to actual cash generated.
5. Putting It All Together
| Metric Type | Formula / Basis | Healthy Threshold | Why It Matters |
|---|---|---|---|
| Payout Ratio | Dividends ÷ Earnings (or FCF) | 30–60% (Earnings), <100% (FCF) | Shows reinvestment potential |
| Dividend Coverage | Earnings ÷ Dividends (DCR) | >2× | Buffer for downturns |
| FCF Coverage | FCF ÷ Dividends | >1.5–2× (CFO) | Measures real cash safety |
6. Real-World Perspectives & Research
- Value Line / Barron’s analysis finds safe dividend companies average ~25% payout (net income/FCF) vs. 40% in the broader index. These firms also show better debt profiles and buy ratings
- UPS recently reassured investors that despite market pressure and a big dividend draw, free cash flow (
$5.7B) comfortably covers dividends ($5.5B), thanks to excluding non-cash pension expenses. Net income coverage also remains solid
7. My Take: Beyond the Ratios
- Trend matters. A low payout ratio one year doesn’t guarantee future strength; check consistency.
- Sector context matters. REITs, utilities, and MLPs operate differently—they may rely on AFFO or DCF, not traditional FCF metrics
- Balance sheet health is critical. Even safe payouts can under pressure if debt levels rise—ratios like net debt to EBITDA offer important perspective
- Strategic patience beats yields. High immediate yields with weak covers often signal future cuts.
8. Conclusion: Ensure Your Divident Flows
If your portfolio includes dividend stocks, ask yourself:
- Is the payout fueled by cash, not just accounting?
- Does earnings comfortably cover the dividend, or just scrape by?
- Does the company manage capital needs and debt well?
Confidence in your Divident comes from seeing strong earnings, healthy free cash flow, a solid dividend coverage buffer, and prudent capital allocation—all working in harmony.