
Exchange-Traded Funds, or ETFs, are super popular. They let investors easily own a piece of many different stocks. Many aim to beat the overall stock market. It’s smart to find ETFs that perform well.
QQQ, also known as the Invesco QQQ Trust, is a top growth ETF. SPMO, the Invesco S&P 500 Momentum ETF, is a strong contender in momentum investing. Both have shown they can do better than the S&P 500 index. We’ll break down these two ETFs. We want to help you decide which one fits your investment goals best.
Understanding the Investment Strategies
QQQ: The NASDAQ 100 Growth Powerhouse
QQQ aims to track the performance of the NASDAQ 100 Index. This index includes the 100 largest non-financial companies on the NASDAQ stock exchange. It’s known for its focus on growth companies.
NASDAQ 100 Index Composition
QQQ’s holdings are heavily weighted toward the technology sector. This means companies like Apple and Microsoft often have a large impact on its returns. Its concentration in tech can lead to big gains when tech stocks do well.
QQQ’s Growth Focus
QQQ is widely recognized as a leading growth ETF. It has a solid track record as a top performer among large-cap growth funds. The Information Technology sector is the driving force behind its success.
SPMO: Capturing S&P 500 Momentum
SPMO seeks to follow the S&P 500 Momentum Index. This index focuses on stocks that have shown strong recent performance. It aims to capture the “momentum” factor in the market.
The Momentum Factor Explained
Momentum investing is based on a simple idea. Stocks that have performed well lately often continue to do so. It’s about riding the wave of recent success.
SPMO’s Selection Methodology
SPMO identifies the top 100 performing stocks within the S&P 500. It uses a momentum score. This score considers price changes and volatility over the last 12 months. The ETF rebalances twice a year. This helps it adapt to changing market trends.
Evaluating Key ETF Metrics
Expense Ratios: The Cost of Investing
Expense ratios are annual fees. They are a small percentage of your investment. Even small fees add up over time. They directly reduce your overall returns.
Direct Comparison: QQQ vs. SPMO
SPMO has a lower expense ratio at 0.13%. QQQ’s expense ratio is 0.20%. While the difference seems small, it matters for long-term growth.
The QQQM Alternative
There’s a version called QQQM. It has a lower expense ratio of 0.15%. It’s essentially the same as QQQ. Many long-term investors prefer QQQM.
Long-Term Fee Impact Illustration
Let’s imagine investing $10,000. Then adding $6,000 each year for 30 years. With a 10% annual return, a 0.13% fee costs about $33,000 in fees. A 0.20% fee costs about $51,000. That’s a big difference over time. Fees might seem low, but they really eat into profits.
Risk Assessment: Volatility and Diversification
We need to look at different types of investment risks. Sector risk is when a specific industry faces problems. Concentration risk occurs when a few stocks greatly influence an ETF’s performance.
Sector and Concentration Risk
QQQ is very concentrated in technology. This can be great in a bull market. But if the tech sector struggles, QQQ could fall sharply. Think back to the dot-com bubble; investors waited years to recover losses.
Stock Market and Volatility Analysis
Markets go up and down. This is stock market risk. We can see how ETFs handle downturns. During the 2022 crash, QQQ lost value faster than SPMO. SPMO held its value better. SPMO has a beta of 0.94. QQQ has a beta of 1.11. Beta shows how volatile an ETF is compared to the market.
Risk-Adjusted Performance: Sharpe Ratio
The Sharpe ratio measures performance against risk. A higher Sharpe ratio is better. SPMO had a better Sharpe ratio recently. However, QQQ showed better risk-adjusted performance from 2019 to 2022.
Diversification and Holdings
Diversification spreads risk across different areas. We look at the number of stocks and sectors. We also check if a few stocks dominate an ETF.
Sector Diversification Breakdown
SPMO is more diversified across sectors. Technology makes up about 24%. Financials are 19%. Consumer Discretionary is 15%. No single sector is too heavy. QQQ, however, is heavily focused on technology.
Top Holdings Comparison
QQQ’s top 10 holdings make up 52.5% of the ETF. SPMO’s top 10 holdings represent 58%. QQQ holds less weight in its top companies. This can reduce the impact of any single stock’s poor performance.
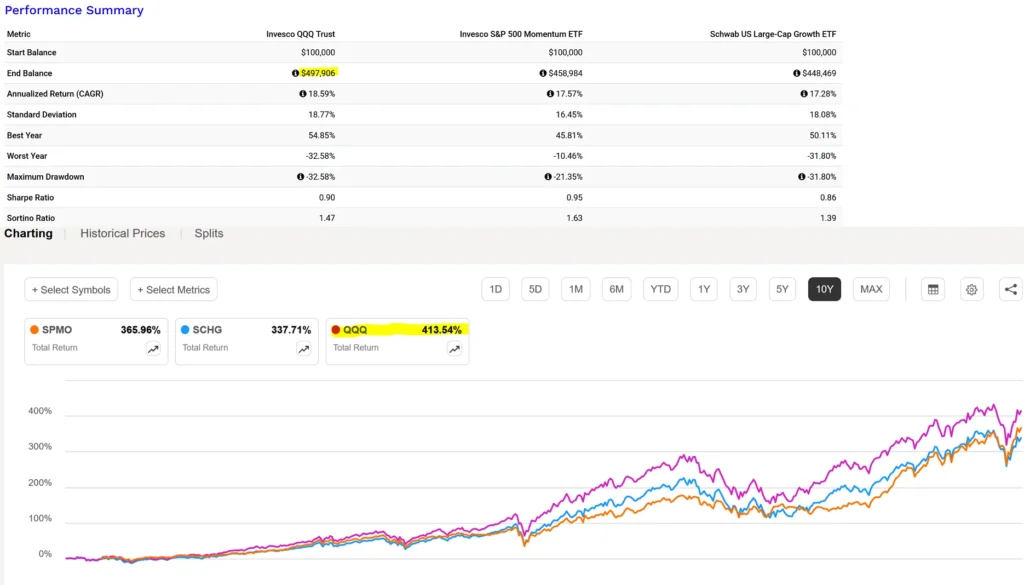
Performance Analysis: A Tale of Two Timeframes
Past performance doesn’t guarantee future results. But it gives us clues about how ETFs have behaved. We can see how they’ve done in good and bad markets.
Short-Term Performance (12 Months & 5 Years)
SPMO recently outperformed QQQ. In the last 12 months, SPMO returned 42%. QQQ returned 29%. Over five years, SPMO gained 157%. QQQ gained 118%. SPMO’s strong performance started in 2022.
Long-Term Performance (10 Years)
Over 10 years, QQQ showed stronger results. It returned 479%. SPMO returned 425%. QQQ’s annualized return was 19.3%. SPMO’s was 18.4%. QQQ had a higher maximum drawdown of -32%. SPMO’s was -21%.
Interpreting Performance Divergence
SPMO’s recent success is linked to big tech companies. These companies did very well. However, this trend might not last forever. QQQ has a better long-term performance history.
Strategic Investment Approach: Tactical Doubling Down
Choosing between great ETFs can be tough. There’s a strategy for this situation. It’s called “tactical doubling down.”
The Tactical Doubling Strategy
This strategy works for similar ETFs you’re unsure about. Invest a set amount each month. Then, check the past 12 months’ returns for both ETFs. Invest more in the one that performed worse.
Benefits of the Tactical Approach
This helps you buy more when an ETF is cheaper. You buy less when it’s more expensive. Over time, this could lead to better returns. You might end up with a 50/50 split. This approach can mathematically boost your returns.
Conclusion: Making the Informed Choice
QQQ offers growth potential. It’s powered by large tech companies. But it comes with more volatility and sector risk. SPMO focuses on momentum. It offers better diversification. It also has lower recent volatility.
Your choice depends on your risk tolerance. Consider your investment time horizon. Do you believe in momentum strategies? The tactical doubling strategy is a smart way to invest. It can help you navigate uncertainty between two strong ETFs.


It’s genuinely very complex in this full of activity life to
listen news on TV, therefore I just use world wide web for that purpose, and take the latest information.
Greetings! Ꮩery heⅼpful advice in this particulaг artіcle!
It is the little cһangeѕ that make the biggest changes.
Thanks for sharing!
Review my web site; trading platform
It’s an awesome paragraph in support of all the online visitors;
they will obtain advantage from it I am sure.